

Numbers are all around us and with numbers come number patterns. And when we research number patterns, we come across something very interesting. Also known as the Newcomb–Benford law, the law of anomalous numbers or the first-digit law, Benford’s Law is a statistical statement about the occurrence of digits in lists of data and is an observation that in many real-life sets of numerical data, the leading digit is likely to be small.
According to the law, in sets that obey the law, the number 1 appears as the leading significant digit about 30% of the time, while 9 appears as the leading significant digit less than 5% of the time. If the digits were distributed uniformly, they would each occur about 11.1 % of the time. Benford’s Law also makes predictions about the distribution of second digits, third digits, digit combinations, and so on. The law is named after physicist Frank Benford, who stated it in 1938 in a paper titled “The Law of Anomalous Numbers”, although it had been previously stated by Simon Newcomb in 1881 and is similar in concept, though not identical in distribution, to the Zipf’s law. So according to Benford’s Law, the finding that the first digits or numerals to be exact of the numbers found in series of records of the most varied sources do not display a uniform distribution, but rather are arranged in such a way that the digit “1” is the most frequent, followed by “2”, “3”, and so in a successively decreasing manner down to “9”
The discovery of Benford’s law goes back to 1881 when the Canadian-American astronomer Simon Newcomb noticed that in logarithm tables the earlier pages that started with 1 were much more worn than the other pages. Newcomb’s published result is the first known instance of this observation and includes distribution on the second digit, as well. Newcomb proposed a law that the probability of a single number N being the first digit of a number was equal to log(N + 1) − log(N). The phenomenon was again noted in 1938 by the physicist Frank Benford, who tested it on data from 20 different domains and was credited for it. Benford’s data set included the surface areas of 335 rivers, the sizes of 3259 US populations, 104 physical constants, 1800 molecular weights, 5000 entries from a mathematical handbook, 308 numbers contained in an issue of Reader’s Digest, the street addresses of the first 342 persons listed in American Men of Science and 418 death rates. The total number of observations used in the paper was 20,229.

It has been shown that this result applies to a wide variety of data sets, including electricity bills, street addresses, stock prices, house prices, population numbers, death rates, lengths of rivers, and physical and mathematical constants. Like other general principles about natural data – for example, the fact that many data sets are well approximated by a normal distribution — some illustrative examples and explanations cover many of the cases where Benford’s law applies, though there are many other cases where Benford’s law applies that resist a simple explanation. It tends to be most accurate when values are distributed across multiple orders of magnitude, especially if the process of generating the numbers is described by a power-law, which is common in nature.
Benford’s law tends to apply most accurately to data that span several orders of magnitude. As a rule of thumb, the more orders of magnitude that the data evenly covers, the more accurately Benford’s law applies. For instance, one can expect that Benford’s law would apply to a list of numbers representing the populations of UK settlements. But if a settlement is defined as a village with a population between 300 and 999, then Benford’s law will not apply.
In general, it has been seen a series of numerical records follows Benford’s Law when they
represents magnitudes of events or events, such as populations of cities, flows of water in rivers or sizes of celestial bodies; do not have pre-established minimum or maximum limits; are not made up of numbers used as identifiers, such as identity or social security numbers, bank accounts, telephone numbers; and have a mean which is less than the median, and the data is not concentrated around the mean
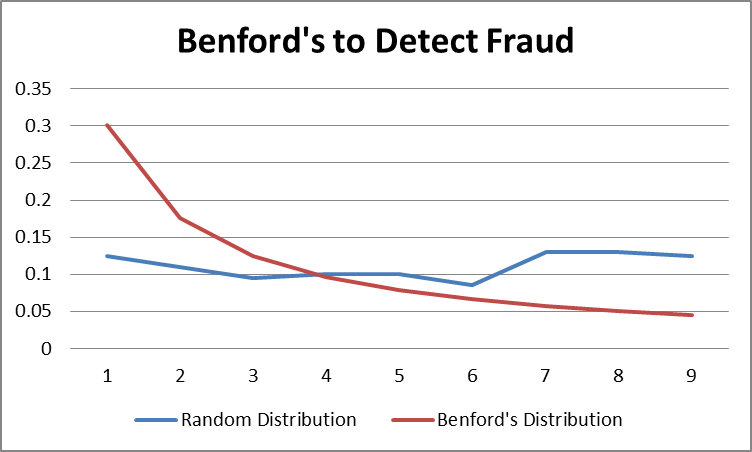
This law can be utilised to detect patterns or the lack thereof in naturally occurring datasets. This can lead to important applications in data science such as catching anomalies or fraud detection. It’s expected that a large set of numbers will follow the law, so accountants, auditors, economists and tax professionals have a benchmark what the normal levels of any particular number in a set are.
In the latter half of the 1990s, accountant Mark Nigrini found that Benford’s law can be an effective red-flag test for fabricated tax returns; True tax data usually follows Benford’s law, whereas made-up returns do not. Ponzi schemes can be detected using the law. Unrealistic returns, such as those purported by the Maddoff scam, fall far from the expected Benford probability distribution.
In 1972, Hal Varian suggested that the law could be used to detect possible fraud in lists of socio-economic data submitted in support of public planning decisions. Based on the plausible assumption that people who fabricate figures tend to distribute their digits fairly uniformly, a simple comparison of first-digit frequency distribution from the data with the expected distribution according to Benford’s law ought to show up any anomalous results. In the United States, evidence-based on Benford’s law has been admitted in criminal cases at the federal, state, and local levels.
Walter Mebane, a political scientist and statistician at the University of Michigan, was the first to apply the second-digit Benford’s law-test (2BL-test) in election forensics. Such analyses are considered a simple, though not foolproof, method of identifying irregularities in election results and helping to detect electoral fraud. Benford’s law has been used as evidence of fraud in the 2009 Iranian elections. An analysis by Mebane found that the second digits in vote counts for President Mahmoud Ahmadinejad, the winner of the election, tended to differ significantly from the expectations of Benford’s Law and that the ballot boxes with very few invalid ballots had a greater influence on the results, suggesting widespread ballot stuffing. Another study used bootstrap simulations to find that the candidate Mehdi Karroubi received almost twice as many vote counts beginning with the digit 7 as would be expected according to Benford’s law, while analysis from Columbia University concluded that the probability that a fair election would produce both too few non-adjacent digits and the suspicious deviations in last-digit frequencies as found in the 2009 Iranian presidential election is less than 0.5%. Benford’s Law has also been applied for forensic auditing and fraud detection on data from the 2003 California gubernatorial election, the 2000 and 2004 United States presidential elections, and the 2009 German federal election.
Benford’s law has also been misapplied to claim election fraud. When applying the law to Joe Biden’s election returns for Chicago, Milwaukee, and other localities in the 2020 United States presidential election, the distribution of the first digit did not follow Benford’s law. The misapplication was a result of looking at data that was tightly bound in range, which violates the assumption inherent in Benford’s law that the range of the data is large.
Macroeconomic data the Greek government reported to the European Union before entering the eurozone was shown to be probably fraudulent using Benford’s law, albeit years after the country joined the EU. In genome data, the number of open reading frames and their relationship to genome size differs between eukaryotes and prokaryotes with the former showing a log-linear relationship and the latter a linear relationship. Benford’s law has been used to test this observation with an excellent fit to the data in both cases. The law has also been used successfully in scientific fraud detection. A test of regression coefficients in published papers showed agreement with Benford’s law. As a comparison group subjects were asked to fabricate statistical estimates. The fabricated results conformed to Benford’s law on first digits but failed to obey Benford’s law on second digits.
So if you want to test Benford’s Law yourself, it’s very simple. Just pick up a random book or magazine and list or sort the numbers. You will find about 30% of the numbers collected from any issue will start with the number 1. Let me know in the comments section if the law fit in your experiment.
